Drive Digital Transformation with Interactive Dashboards
July 8, 2019, by Sean King

Firms that have embraced real-time digital dashboard reporting have improved operational intelligence, increased efficiency, and have higher levels of user engagement. Find out why adopting interactive dashboards should be a key part of your digital transformation roadmap.
Background
Play to the crowd, or at least two-thirds of them!
Around 65% of the population are visual learners. This means seeing is how they best absorb and process information. Dashboards have emerged as a tool for boosting operational intelligence, but adoption doesn't always entail optimized usage.
When properly implemented, dashboards present the opportunity to supercharge organizational data presentation and analysis. It's little wonder that business analysts and organizational leaders value the power of dashboards so highly when implemented well.
So, let's discuss what effective dashboard usage looks like and how it can benefit you.
What are dashboards?
Traditionally, dashboards have been reporting mechanisms that are used to curate and clearly display organizational data.
Managing your business efficiently is more intuitive when dashboards are used as an effective tool. However, they can fail to live up to their full potential if not configured to display meaningful key performance indicators (KPI's) or restricted to merely displaying info without the ability to interact with the data.
What makes a dashboard interactive?
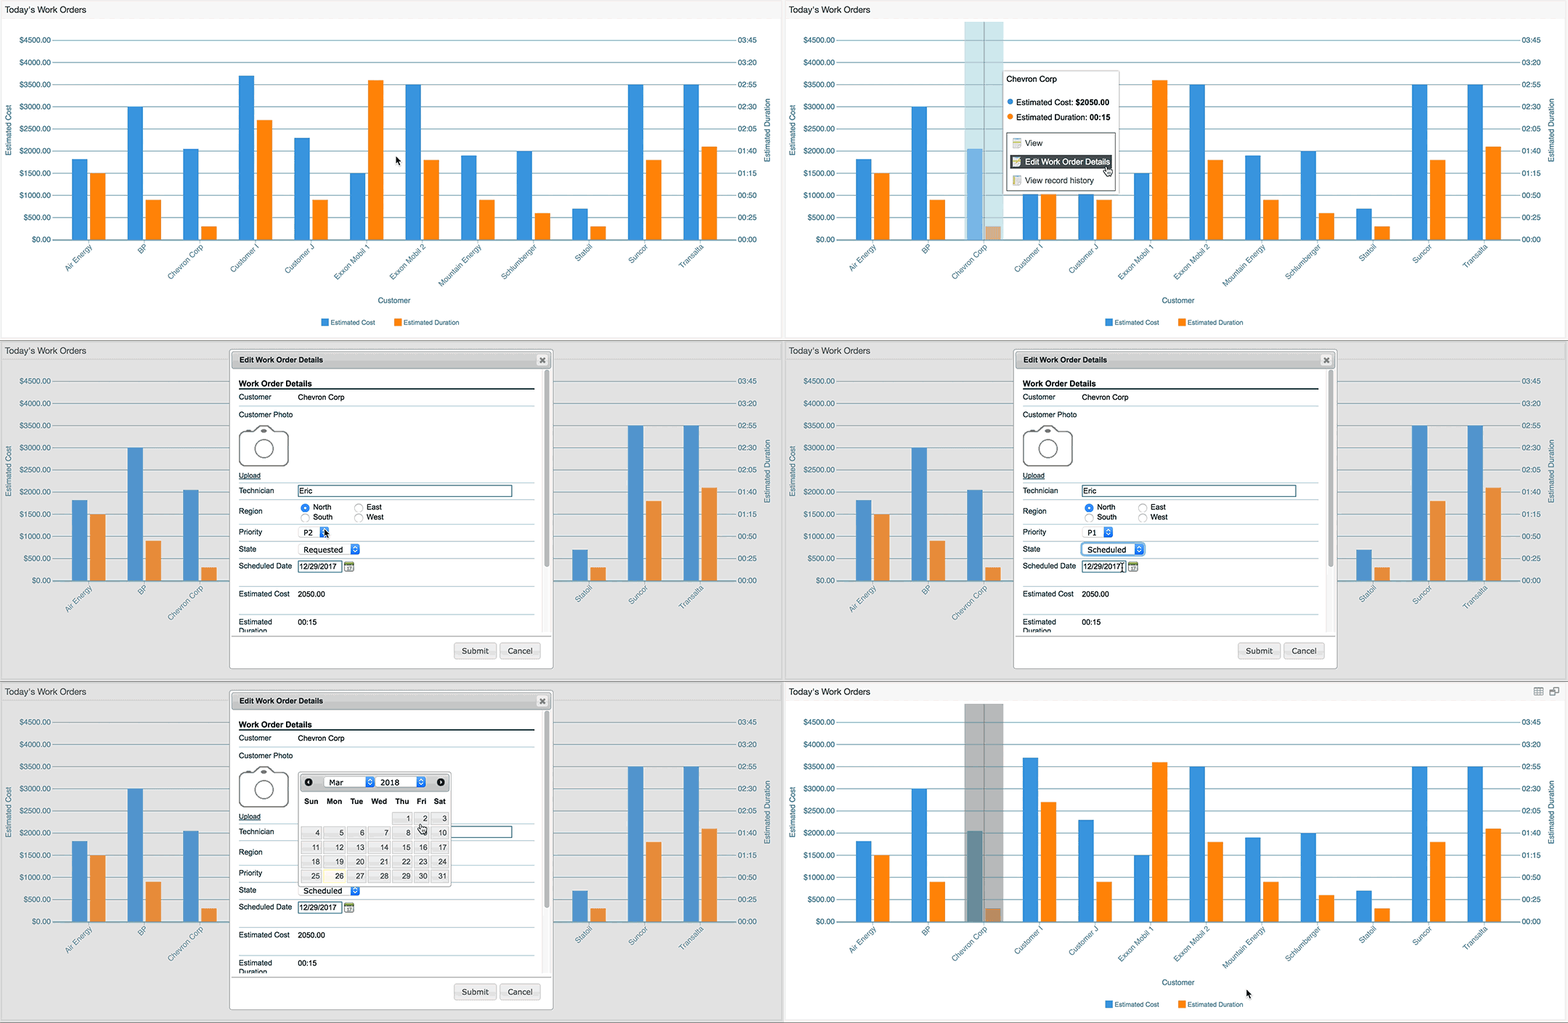
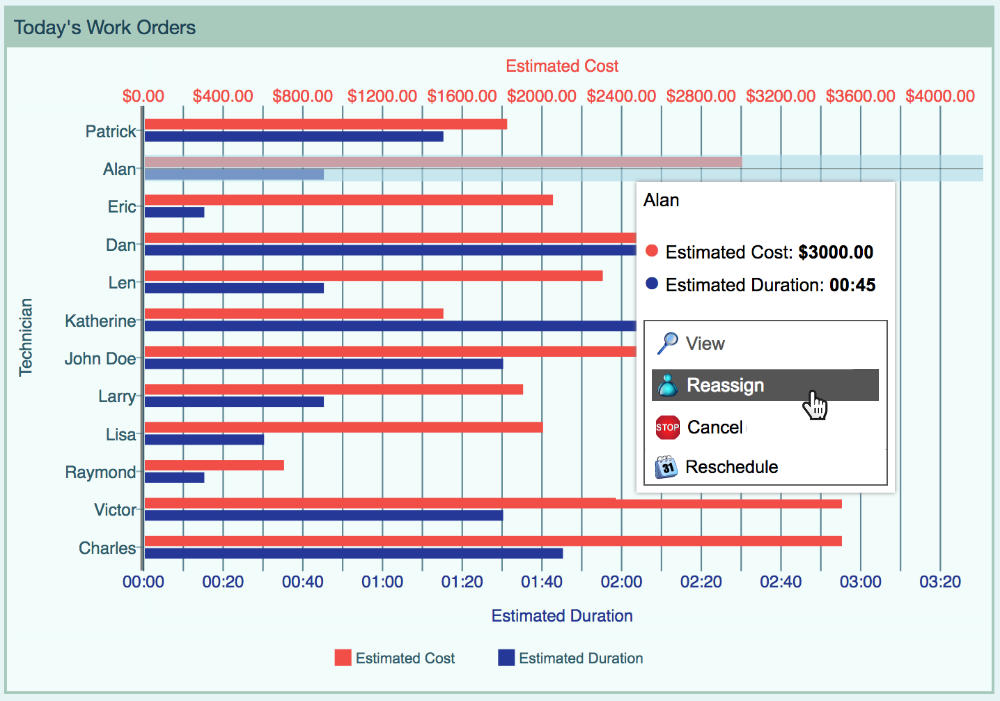
Basic dashboards display curated data. An interactive dashboard allows users to act on that data instantly to create and assign tasks, or easily generate and filter reports to understand the underlying issues affecting performance and take immediate action. This aids organizational intelligence by highlighting where to assign resources or when to escalate challenging situations.
Use interactive real-time dashboards to streamline your business processes, increase employee engagement, and reduce latency in your information ecosystem.
Some key benefits of interactive dashboards include:
Visualization
Dashboards provide an intuitive and accessible platform for data analysis. Presenting data in a dashboard aids visual learners and empowers team members to analyze data and develop strategic insights.
It takes skill and experience to analyze raw data. By leveraging dashboards to present information graphically, you allow more people throughout your organization to spot exceptions and opportunities. Dashboards create an interface between critical data and employees, democratizing the ability to make operational performance improvements.

Insight to Action
Interactive dashboards act as a springboard to drive user insights into actions. The ability to create and edit tasks and processes takes dashboard usage to a new level. Identify issues and then launch action from within the dashboard to save time and effort.
When you can notify users to act instantly via the dashboard as soon as you notice any irregularity you eliminate the need to open Outlook or reach for your smartphone. This alone streamlines your internal communications, improving response time for actionable requests.
Flexible & Customizable
Dashboards need to be customizable to grow with your organization. The KPI's you focus on may change as your business evolves. Off-the-shelf solutions often lack the flexibility to display what is relevant to you and cannot be easily updated when your needs change. Your system should provide customizable dashboards that can be easily modified without code.
It is essential that dashboards can integrate with other systems and offer flexibility for future integrations. Dashboards should help optimize and improve business processes and not complicate or break existing workflows by requiring extensive integrations.

Real-Time & Mobile Friendly
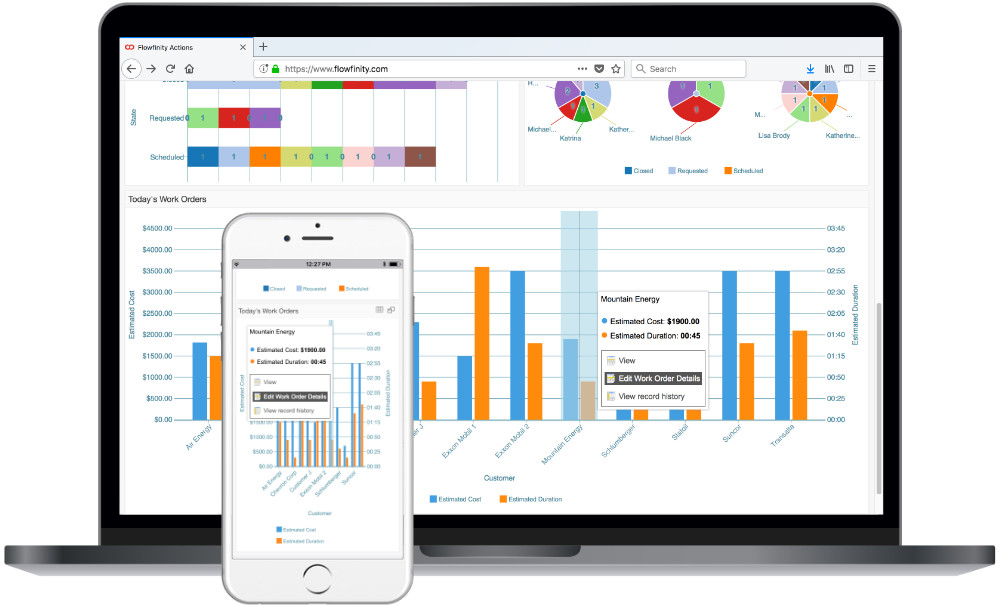
Dashboards, like your users, need to be mobile. Offering a snapshot of real-time performance is as valuable, if not more, out of the office as in it.
Organizations should seek out dashboards that are compatible with a wide range of devices to provide frictionless access to real-time data. Team members in the field can view their outstanding tasks on the move while managers can view operations from anywhere.
Dashboards optimized for mobile allow managers to stay on top of time-sensitive information across all devices, which speeds up and improves decision-making capabilities.
Accountability & Alignment
Dashboards help ensure everyone on your team remains accountable.
For example, salespeople can continually benchmark their performance at a glance while managers can see how their departments are performing in real-time. Logistics can spot errors or opportunities in resource allocation quickly, then act immediately.
This can be a virtuous cycle within your business, by increasing the visibility into operations, you can raise the level of performance throughout a department or the whole organization.
When evolving competitive forces require you to shift focus and put in place new strategies, it can take time for everyone in an organization to get on the same page. Create dashboards that highlight new KPIs to educate employees and encourage the adoption of new processes and broader organizational change.
For example, to maintain SLA performance, a Customer Success team monitors an 'initial response time' KPI. After analyzing operations, management suggests focusing on resolving queries in a shorter timeframe instead.
By amending the Customer Success dashboard to reflect this new thinking, the shift in departmental focus is clearly communicated, and alignment can be quickly achieved.

Reporting & Drill-downs
Dashboards bring together a snapshot of KPIs, pulled from an underlying dataset, this significantly reduces the time spent on reporting.
In the past, organizations spent considerable time and resources to collect and process data into meaningful information. Often this required an export of data and significant manipulation in spreadsheets to perform analysis. Managers and analysts particularly value dashboards for performing much of this manual formatting and processing legwork for you.
Use drill-down functions to allow further analysis within a few clicks. Find out why corrective action was necessary for a specific incident. Investigate unique details of a specific case and view high-level snapshots of operations without leaving the dashboard.
Conclusion
Organizations should be looking for tools that make reporting intuitive and instantaneous. Adopting interactive dashboards that can be easily configured without code can enhance operational intelligence long-term. With so many benefits derived from adopting interactive dashboards, now is the time to empower your business to make better decisions.
About Flowfinity
Flowfinity is a no-code business application development toolset for building sophisticated workflows with complex data models and interactive dashboards. Using a declarative approach, it is possible to configure, test, and deploy apps in days, not weeks or months!
Our platform combines a web-based app editor with a cloud database and robust integration capabilities. Enable business and IT professionals with powerful interactive dashboards that turn insight into action and evolve with your organization. Promote smarter, faster decision-making by providing users with real-time data.
Contact us for a demonstration of how to create and customize a variety of dashboards that will help transform your business.

